
Page 18 - HMC 2021 HISPANIC MARKET GUIDE
P. 18
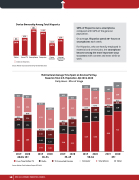
   Device Ownership Among Total Hispanics
 125 88
129 115
Source: Nielsen Cultural Connectivity Transformed 2020
104
113
98%
 89%
 66%
 62%
 56%
 46%
 Tablet
Smart TV
Smartphone
Computer Game Console
Internet Connected Device
Index to Total U.S.
 Multicultural Average Time Spent on Devices Per Day, Based on Total U.S. Population, Q2 2019-2020 Daily Hours : Mins of Usage
 1:04
 2:09
 0:59
 3:26
 0:39
 1:05
 2:26
 0:58
   0:53
 3:43
0:55
 0:53
 0:55
2:40
   0:46
0:31 0:23
   0:39
 4:24
 2:56
 4:17
3:13
0:24
0:39
   1.38
  0:39
1:00
  0:33
0:36
1.42
    0:40
    0:50
1:14
3:30
0:44
2:05
1.58
   0:37
     1.42
1.34
0:58
1:29
   0:37
1.45
     6:46
7:15
  4:04
4:08
1:15
1:19
1:40
1.35
  1.11
3:18
3:12
5:19
5:36
  1:42
1:26
 2019 2020
Adults 18+
Live+Time Shifted TV
0:31
2019 2020
18–34
Radio
2019 2020 2019 2020
35–49 50–64
TV-Connected Devices Computer
2019 2020
65+
Source: Nielsen Total Audience Report SEP 2020
98% of Hispanics own a smartphone, compared with 93% of the general population.
On average, Hispanics spend 30+ hours on smartphones each week.
For Hispanics, who are heavily employed in essential and service jobs, the smartphone became among the most important ways to connect with content and news while at work.
Smartphone
Tablet
18
HMC 2021 HISPANIC MARKETING COUNCIL
